THE VALLEY’S MAJOR MARKETS:
THE CROMFORD INDEX, shows the ratio of Supply to Demand. At an index of 100, everything is equal and in Balance and neither Buyer or Seller holds a market advantage.
SELLER'S MARKETS (Where Demand exceeds Supply)
Paradise Valley (178.2) down 7% from last month
Anthem (163) up 24.8% from last month
Fountain Hills (150.2) up 31% from last month
Sun Lakes (145.5) up 37% from last month
Scottsdale (130) up 25% from last month (but luxury is still scarce)
El Mirage (128) up 17.1% from last month
Apache Junction (127.4) up 18.3% from last month
Chandler (127.1) up 10% from last month
Cave Creek (125.7) up 14% from last month
Avondale (118.9) up 14% from last month
BALANCED MARKETS (100 is in perfect balance)
Sun City West (110) up 6.6% from last month
Gilbert (106.7) up 14% from last month
Phoenix (104.7) up 8% from last month
Glendale (104.1) down 1% from last month
Mesa (92.4) up 8% from last month
Tolleson (92.8) down 7.5% from last month
BUYER’S MARKETS (Where Supply exceeds demand)
Sun City (89) up 9.2% from last month
Peoria (87.1) up 1% from last month
Gold Canyon (71.3) up 20.2% from last month
Tempe (81.3) down 3% from last month
Goodyear (79.3) up 2% from last month
Laveen (72.6) down 8.8% from last month
Surprise (68.8) up 13% from last month
Litchfield Park (64.1) up 11.9% from last month
Queen Creek (63.5) up 3% from last month
Buckeye (51.2) up 1% from last month
Maricopa (47.7) down 3% from last month
Casa Grande (47.4) down 7.8% from last month
MAJOR MARKET HIGHLIGHTS FROM THE INCLUDED GRAPHICS & CHARTS:
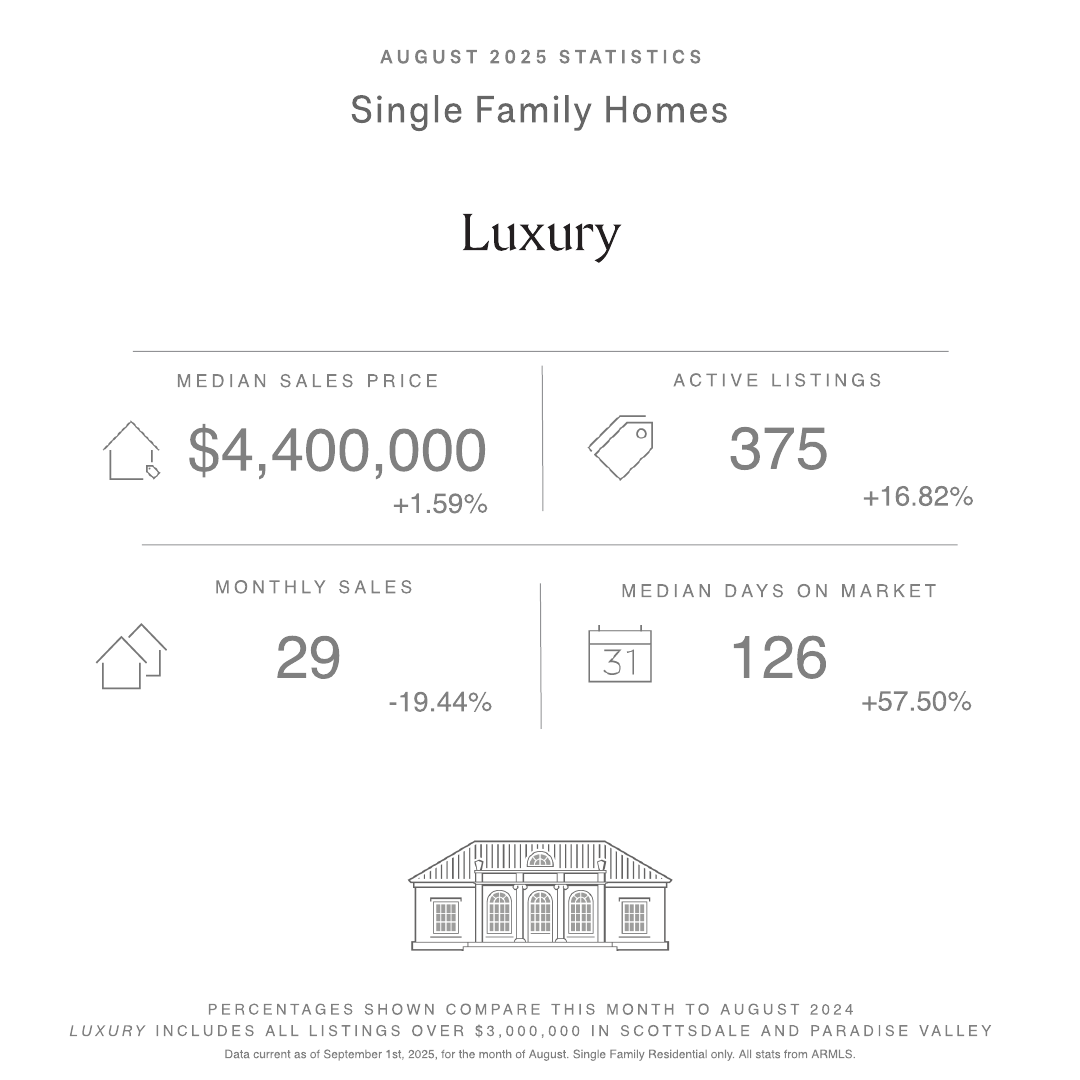
LUXURY
Median Luxury Sales Price: $4,400,000 – up 1.59% from August ’24.
Active Luxury Listings (inc. UCB/CCBS): 375 Listings - up 16.82% from August ‘24.
Monthly Sales for Luxury Listings: 29 – down 19.44% from August ‘24.
Median Days on Market for Luxury Listings: 126 – up 57.5% from August ‘24.
PARADISE VALLEY
Median Paradise Valley Sales Price: $2,850,000 – down 24.3% from August ’24.
Active Listings (inc. UCB/CCBS): 1309 Listings – unchanged from August ‘24.
Monthly Sales for Paradise Valley Listings: 21 – down 12.5% from August ‘24.
Median Days on Market for Paradise Valley Homes: 132 – up 20% from August ‘24.
SCOTTSDALE
Median Scottsdale Sales Price: $792,500 – down 6.21% from August ’24.
Active Scottsdale Single Family Home Listings (inc. UCB/CCBS): 1,869 Listings- up 10.39% from August ‘24.
Monthly Sales for Scottsdale Single Family Homes: 440 – down 1.12% from August ‘24.
Median Days on Market for Scottsdale Single Family Homes: 71 – up 14.51% from August ‘24.
PHOENIX
Median Phoenix Sales Price: $431,000 – up .23% from August ’24.
Active Phoenix Single Family Home Listings (inc. UCB/CCBS): 3,803 Listings - up 21.81% from August ’24.
Monthly Sales for Phoenix Single Family Homes: 1,028 – up 7.98% from August ‘24.
Median Days on Market for Phoenix Single Family Homes: 55 - up 22.22% from August ‘24.
CAVE CREEK
Median Cave Creek Sales Price: $700,000 – up 14.11% from August ’24.
Active Cave Creek Single Family Home Listings (inc. UCB/CCBS): 185 Listings - unchanged from August ’24.
Monthly Sales for Cave Creek Single Family Homes: 49 – up 19.51% from August ‘24.
Median Days on Market for Cave Creek Single Family Homes: 80 – up 5.26% from August ‘24.
CAREFREE
Median Carefree Sales Price: $1,385,000 – down 31.90% from August ’24.
Active Carefree Single Family Home Listings: 53 - up 39.47% from August ‘24.
Monthly Sales for Carefree Single Family Homes: 7 - unchanged from August ‘24.
Median Days on Market for Carefree Single Family Homes: 117 – up 105.26% from August ‘24.
EAST VALLEY
Median East Valley Sales Price: $510,000 – down 0.29% from August ’24.
Active East Valley Single Family Home Listings: 4,312 - up 30.94% from August ‘24.
Monthly Sales for East Valley Single Family Homes: 1,269 – up 3.17% from August ‘24.
Median Days on Market for East Valley Single Family Homes: 57 – up 39.02% from August ‘24.
WEST VALLEY
Median West Valley Sales Price: $430,000 down 1.86% from August ’24.
Active West Valley Single Family Home Listings: 5,135 – up 31.51% from August ‘24.
Monthly Sales for West Valley Single Family Homes: 1,341 – up 1.98% from August ‘24.
Median Days on Market for West Valley Single Family Homes: 63 – up 28.57% from August ‘24.
_1.jpeg)
.pdf%20(5).png)